OPC Diagnostics facilitate troubleshooting OPC client issues

Find out what your OPC client actually requested and what TOP Server actually replied

The OPC Diagnostics Window provides a real-time and historical view of OPC events that occur between any OPC client and the TOP Server. An OPC event is a method call that a client makes to the TOP Server, or a callback the TOP Server makes to a client.

The OPC Diagnostics Window is separate from the main TOP Server configuration window, which allows you to hide the window even while diagnostics are being captured. In the event that there is an issue between a client and the TOP Server, the Diagnostics Window can be opened to display the events that have occurred. The operation of the OPC Diagnostics Window can be controlled through its’ menu, toolbar or by right-clicking in the Event Window.

Diagnose connections for OPC UA, OPC DA & OPC HDA clients

TOP Server supports capturing events and details for:

  • OPC UA (Data Access Profile)
  • OPC Classic DA (Data Access)
  • OPC Classic HDA (Historical Data Access).

To determine the meaning of the data presented by this window, refer to those specifications. Copies of these specifications are available to OPC Foundation members on the OPC Foundation web site (Information on joining the OPC Foundation is also provided).

Diagnose issues with OPC client connections over time with file persistence

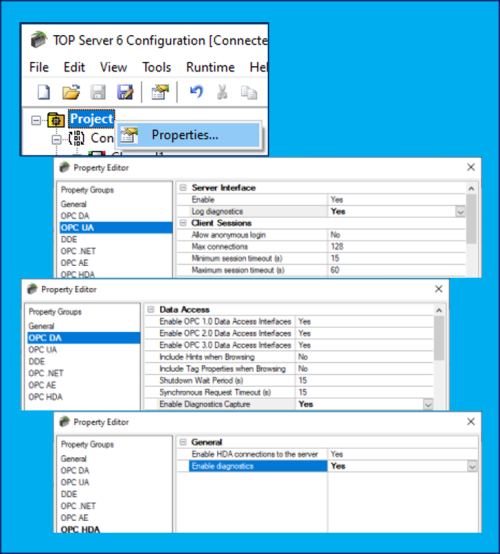
The TOP Server also allows OPC Diagnostics to be persisted to file. Capturing diagnostics must be enabled for each specific OPC interface in the TOP Server Project Properties.

The persistence settings for TOP Server OPC Diagnostics are configurable and located under the TOP Server Administration settings, under the Event Log tab, as shown to the left.

  • Persistence Mode:
    • Memory (no persistence) - The default option follows the legacy behavior of OPC Diagnostics and diagnostics are not persisted to file in this mode.
    • Single File - All diagnostics records will be persisted to one file only.
    • Extended Data Store - Enables spanning of diagnostics records across multiple files based on the other settings.
  • Max Records - Maximum number of records that the log can contain before the oldest records start being overwritten (Only available for Memory or Single File modes).
  • Log File Path - File system directory where log files will be stored.
  • Max single file size (KB) - Maximum size in KB that any one log file can contain. (Only available for Extended Data Store Mode).
  • Min days to preserve - Once log files are older than this number, they will be deleted. (Only available for Extended Data Store Mode).

Viewing OPC Diagnostics in real-time

The OPC Diagnostics window can be accessed under View -> OPC Diagnostics in the TOP Server Configuration.  This interface allows viewing live diagnostics or opening a saved diagnostics file using the File menu.

Saved OPC Diagnostics can be sent to the Software Toolbox technical support team for assistance in troubleshooting any OPC issues you may be experiencing.

Additionally, under Diagnostics -> Filter, it's possible to filter which specific OPC calls will be displayed, by OPC specification. This makes it easier to troubleshoot when you know you're looking for a specific call such as an OPC UA Publish event or an OPC DA Data Callback event.

Important Notes:

  • You must be in Runtime Mode in the Configuration to be able to access OPC diagnostics. See Offline Editing for more information.
  • OPC Diagnostics is disabled for each OPC interface by default - so the specific OPC interface must be enabled in the TOP Server Project Properties in order for OPC Diagnostics to be enabled for that interface.
  • See the TOP Server Main Help file under Built-in Diagnostic -> OPC Diagnostics Viewer for full details on how to use OPC Diagnostics including settings and filters.

Get Started Now

The demo is the full product once licensed. Once a client application connects to the  TOP Server, the TOP Server runtime will operate for 2 hours at a time. At the end of the 2 hour demo period, the demo timer must be reset by restarting the TOP Server runtime service.

Connect with Us

1-888-665-3678 (US + Canada toll free)
+1-704-849-2773 (Global)
support.softwaretoolbox.com